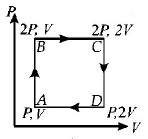
Question
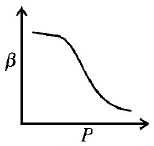
Which of the following graphs correctly represents the variation $$\beta = - \frac{{\frac{{dV}}{{dP}}}}{V}$$ with $$P$$ for an ideal gas at constant temperature ?
A.
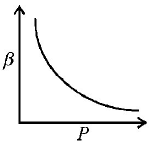

B.
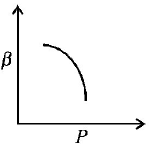

C.
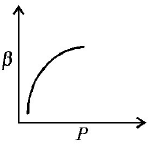

D.

Answer :


Solution :
$$PV$$ = constant. Differentiating,
$$\eqalign{ & \frac{{P\,dV}}{{dP}} = - V;\beta \cr & = - \left( {\frac{1}{V}} \right)\left( {\frac{{dV}}{{dP}}} \right) \cr & = \left( {\frac{1}{P}} \right) \cr & \Rightarrow \,\,\beta \times P = 1 \cr} $$
∴ Graph between $$\beta $$ and $$P$$ will be a rectangular hyperbola.
