Question
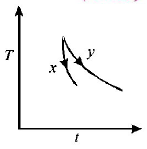
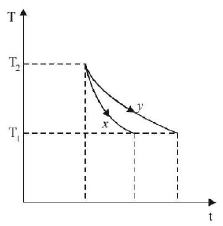
The graph, shown in the adjacent diagram, represents the variation of temperature $$(T)$$ of two bodies, $$x$$ and $$y$$ having same surface area, with time $$(t)$$ due to the emission of radiation. Find the correct relation between the emissivity and absorptivity power of the two bodies
The graph, shown in the adjacent diagram, represents the variation of temperature $$(T)$$ of two bodies, $$x$$ and $$y$$ having same surface area, with time $$(t)$$ due to the emission of radiation. Find the correct relation between the emissivity and absorptivity power of the two bodies

A.
$${E_x} > {E_y}\,\,\& \,\,{a_x} < {a_y}$$
B.
$${E_x} < {E_y}\,\,\& \,\,{a_x} > {a_y}$$
C.
$${E_x} > {E_y}\,\,\& \,\,{a_x} > {a_y}$$
D.
$${E_x} < {E_y}\,\,\& \,\,{a_x} < {a_y}$$
Answer :
$${E_x} > {E_y}\,\,\& \,\,{a_x} > {a_y}$$
Solution :
The graph shows that for the same temperature difference $$\left( {{T_2} - {T_1}} \right),$$ less time is taken for $$x.$$ This means the emissivity is more for $$x.$$ According to Kirchoff's law, a good emitter is a good absorber as well.

The graph shows that for the same temperature difference $$\left( {{T_2} - {T_1}} \right),$$ less time is taken for $$x.$$ This means the emissivity is more for $$x.$$ According to Kirchoff's law, a good emitter is a good absorber as well.


