Question
A sample of gas expands from volume $${V_1}$$ to $${V_2}.$$ The amount of work done by the gas is greatest when the expansion is
A.
adiabatic
B.
isobaric
C.
isothermal
D.
Equal in all above cases
Answer :
isobaric
Solution :
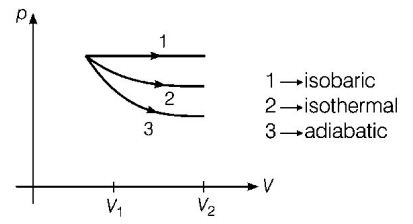
The $$p-V$$ diagram for isobaric, isothermal and adiabatic processes of an ideal gas is shown in graph below

In thermodynamics, for some change in volume, the work done is maximum for the curve having maximum area enclosed with the volume axis. Area enclosed by the curve $$ \propto \left( {{\text{Slope of curve}}} \right)$$
NOTE
$$\eqalign{ & {\left( {{\text{Slope}}} \right)_{{\text{isobaric}}}} < {\left( {{\text{Slope}}} \right)_{{\text{isothermal}}}} < {\left( {{\text{Slope}}} \right)_{{\text{adiabatic}}}} \cr & {\left( {{\text{Area}}} \right)_{{\text{isobaric}}}} > {\left( {{\text{Area}}} \right)_{{\text{isothermal}}}} > {\left( {{\text{Area}}} \right)_{{\text{adiabatic}}}} \cr} $$
Hence, work done is maximum in isobaric process.
$$\eqalign{ & {\left( {{\text{Slope}}} \right)_{{\text{adiabatic}}}} = - \gamma \left( {\frac{p}{V}} \right) \cr & {\text{and}}\,\,{\left( {{\text{Slope}}} \right)_{{\text{isothermal}}}} = - \frac{p}{V} \cr} $$
$$\therefore {\left( {{\text{Slope}}} \right)_{{\text{adiabatic}}}} = \gamma \times {\left( {{\text{Slope}}} \right)_{{\text{isothermal}}}}$$
Slope of adiabatic curve is always steeper than that of isothermal curve.
The $$p-V$$ diagram for isobaric, isothermal and adiabatic processes of an ideal gas is shown in graph below

In thermodynamics, for some change in volume, the work done is maximum for the curve having maximum area enclosed with the volume axis. Area enclosed by the curve $$ \propto \left( {{\text{Slope of curve}}} \right)$$
NOTE
$$\eqalign{ & {\left( {{\text{Slope}}} \right)_{{\text{isobaric}}}} < {\left( {{\text{Slope}}} \right)_{{\text{isothermal}}}} < {\left( {{\text{Slope}}} \right)_{{\text{adiabatic}}}} \cr & {\left( {{\text{Area}}} \right)_{{\text{isobaric}}}} > {\left( {{\text{Area}}} \right)_{{\text{isothermal}}}} > {\left( {{\text{Area}}} \right)_{{\text{adiabatic}}}} \cr} $$
Hence, work done is maximum in isobaric process.
$$\eqalign{ & {\left( {{\text{Slope}}} \right)_{{\text{adiabatic}}}} = - \gamma \left( {\frac{p}{V}} \right) \cr & {\text{and}}\,\,{\left( {{\text{Slope}}} \right)_{{\text{isothermal}}}} = - \frac{p}{V} \cr} $$
$$\therefore {\left( {{\text{Slope}}} \right)_{{\text{adiabatic}}}} = \gamma \times {\left( {{\text{Slope}}} \right)_{{\text{isothermal}}}}$$
Slope of adiabatic curve is always steeper than that of isothermal curve.
